
Overview
The PLU Sales Report provides a detailed breakdown of sales by individual PLU (Price Look-Up) code. Each menu item, modifier, and option choice has its own PLU code, allowing you to review how often each one was sold during a selected date range.
Use this report to:
- Identify your most and least popular menu items.
- Compare modifier and option choice selections.
- Review sales by location.
- Make informed decisions about pricing and menu updates.
- Determine whether rarely selected options should be updated, replaced, or removed.
Accessing the Report
Go to the More tab in your CaterZen account.
Select Reports → Sales Reports.
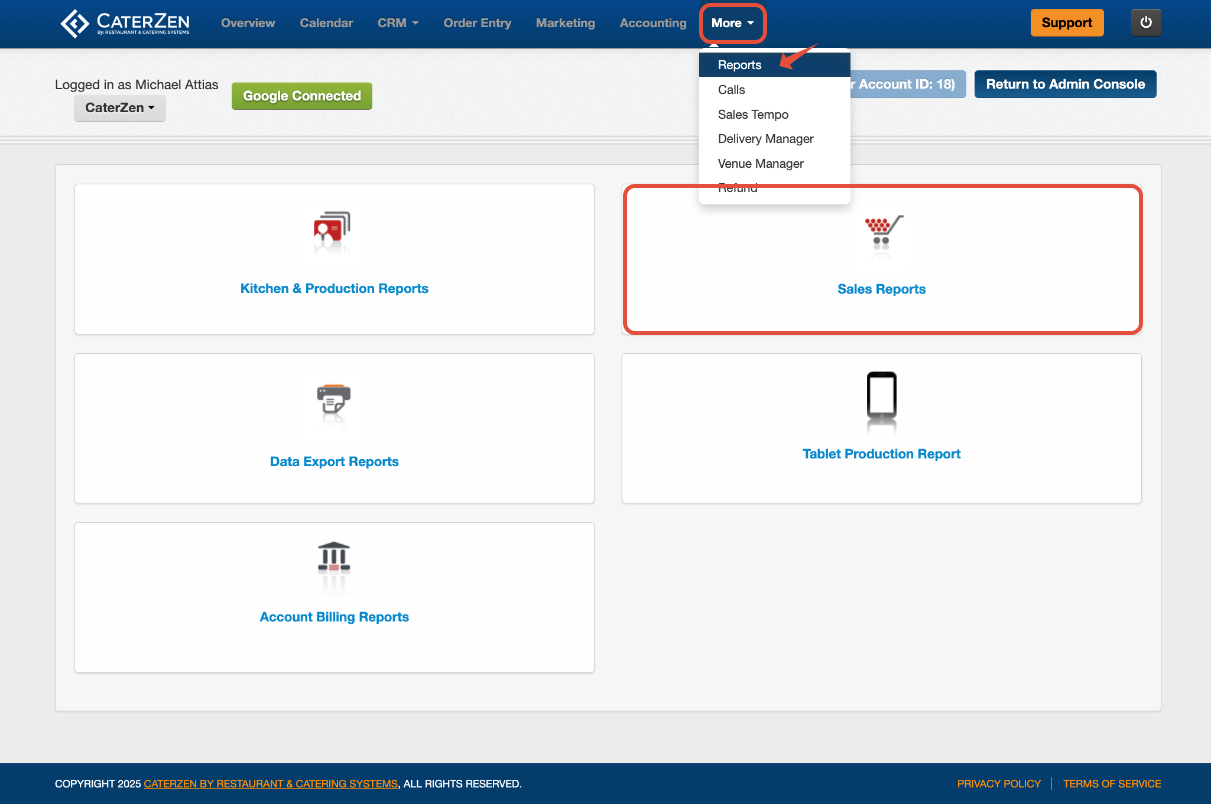
Click PLU Sales Report.
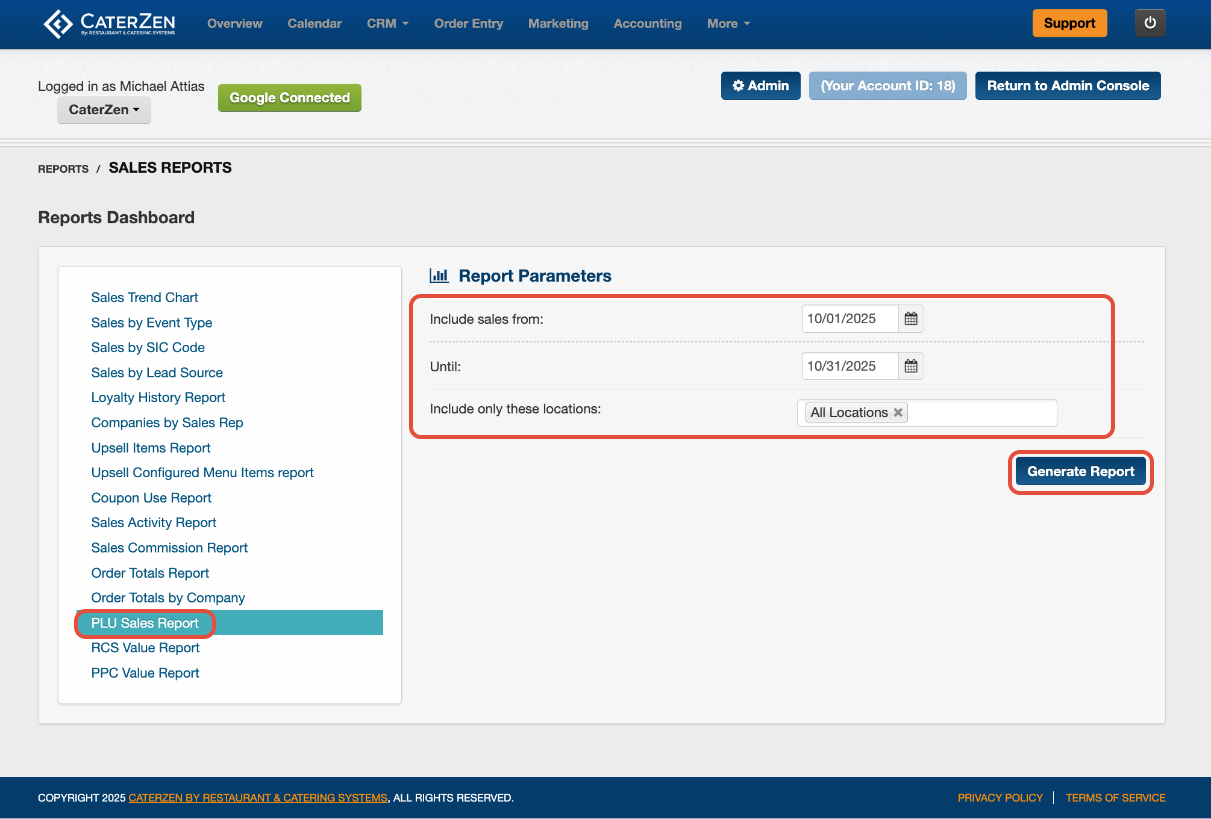
Choose your Filter Parameters (see below).
Click Generate Report.
Filter Parameters
Use these filters to control which PLU sales data appears in your export:
Date Range – Select the time period you want to review.
Location – Choose one or multiple store locations.
Exporting or Sharing
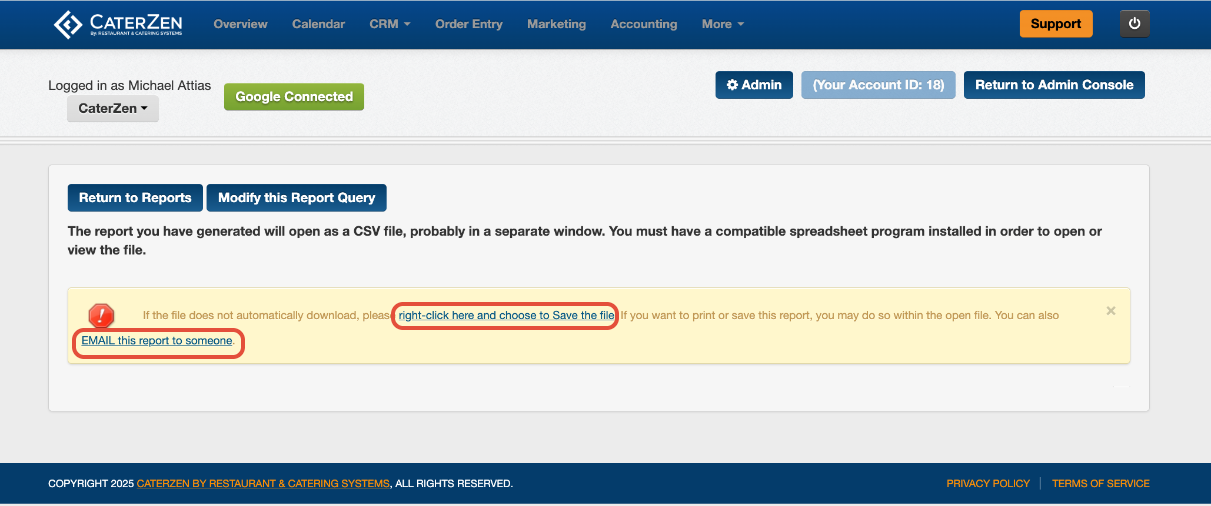
The report automatically downloads as an csv file when generated. You can save by right clicking.
You can also email the report directly to yourself or another team member.
Once exported, you can sort or filter to analyze performance trends.
Understanding the Report
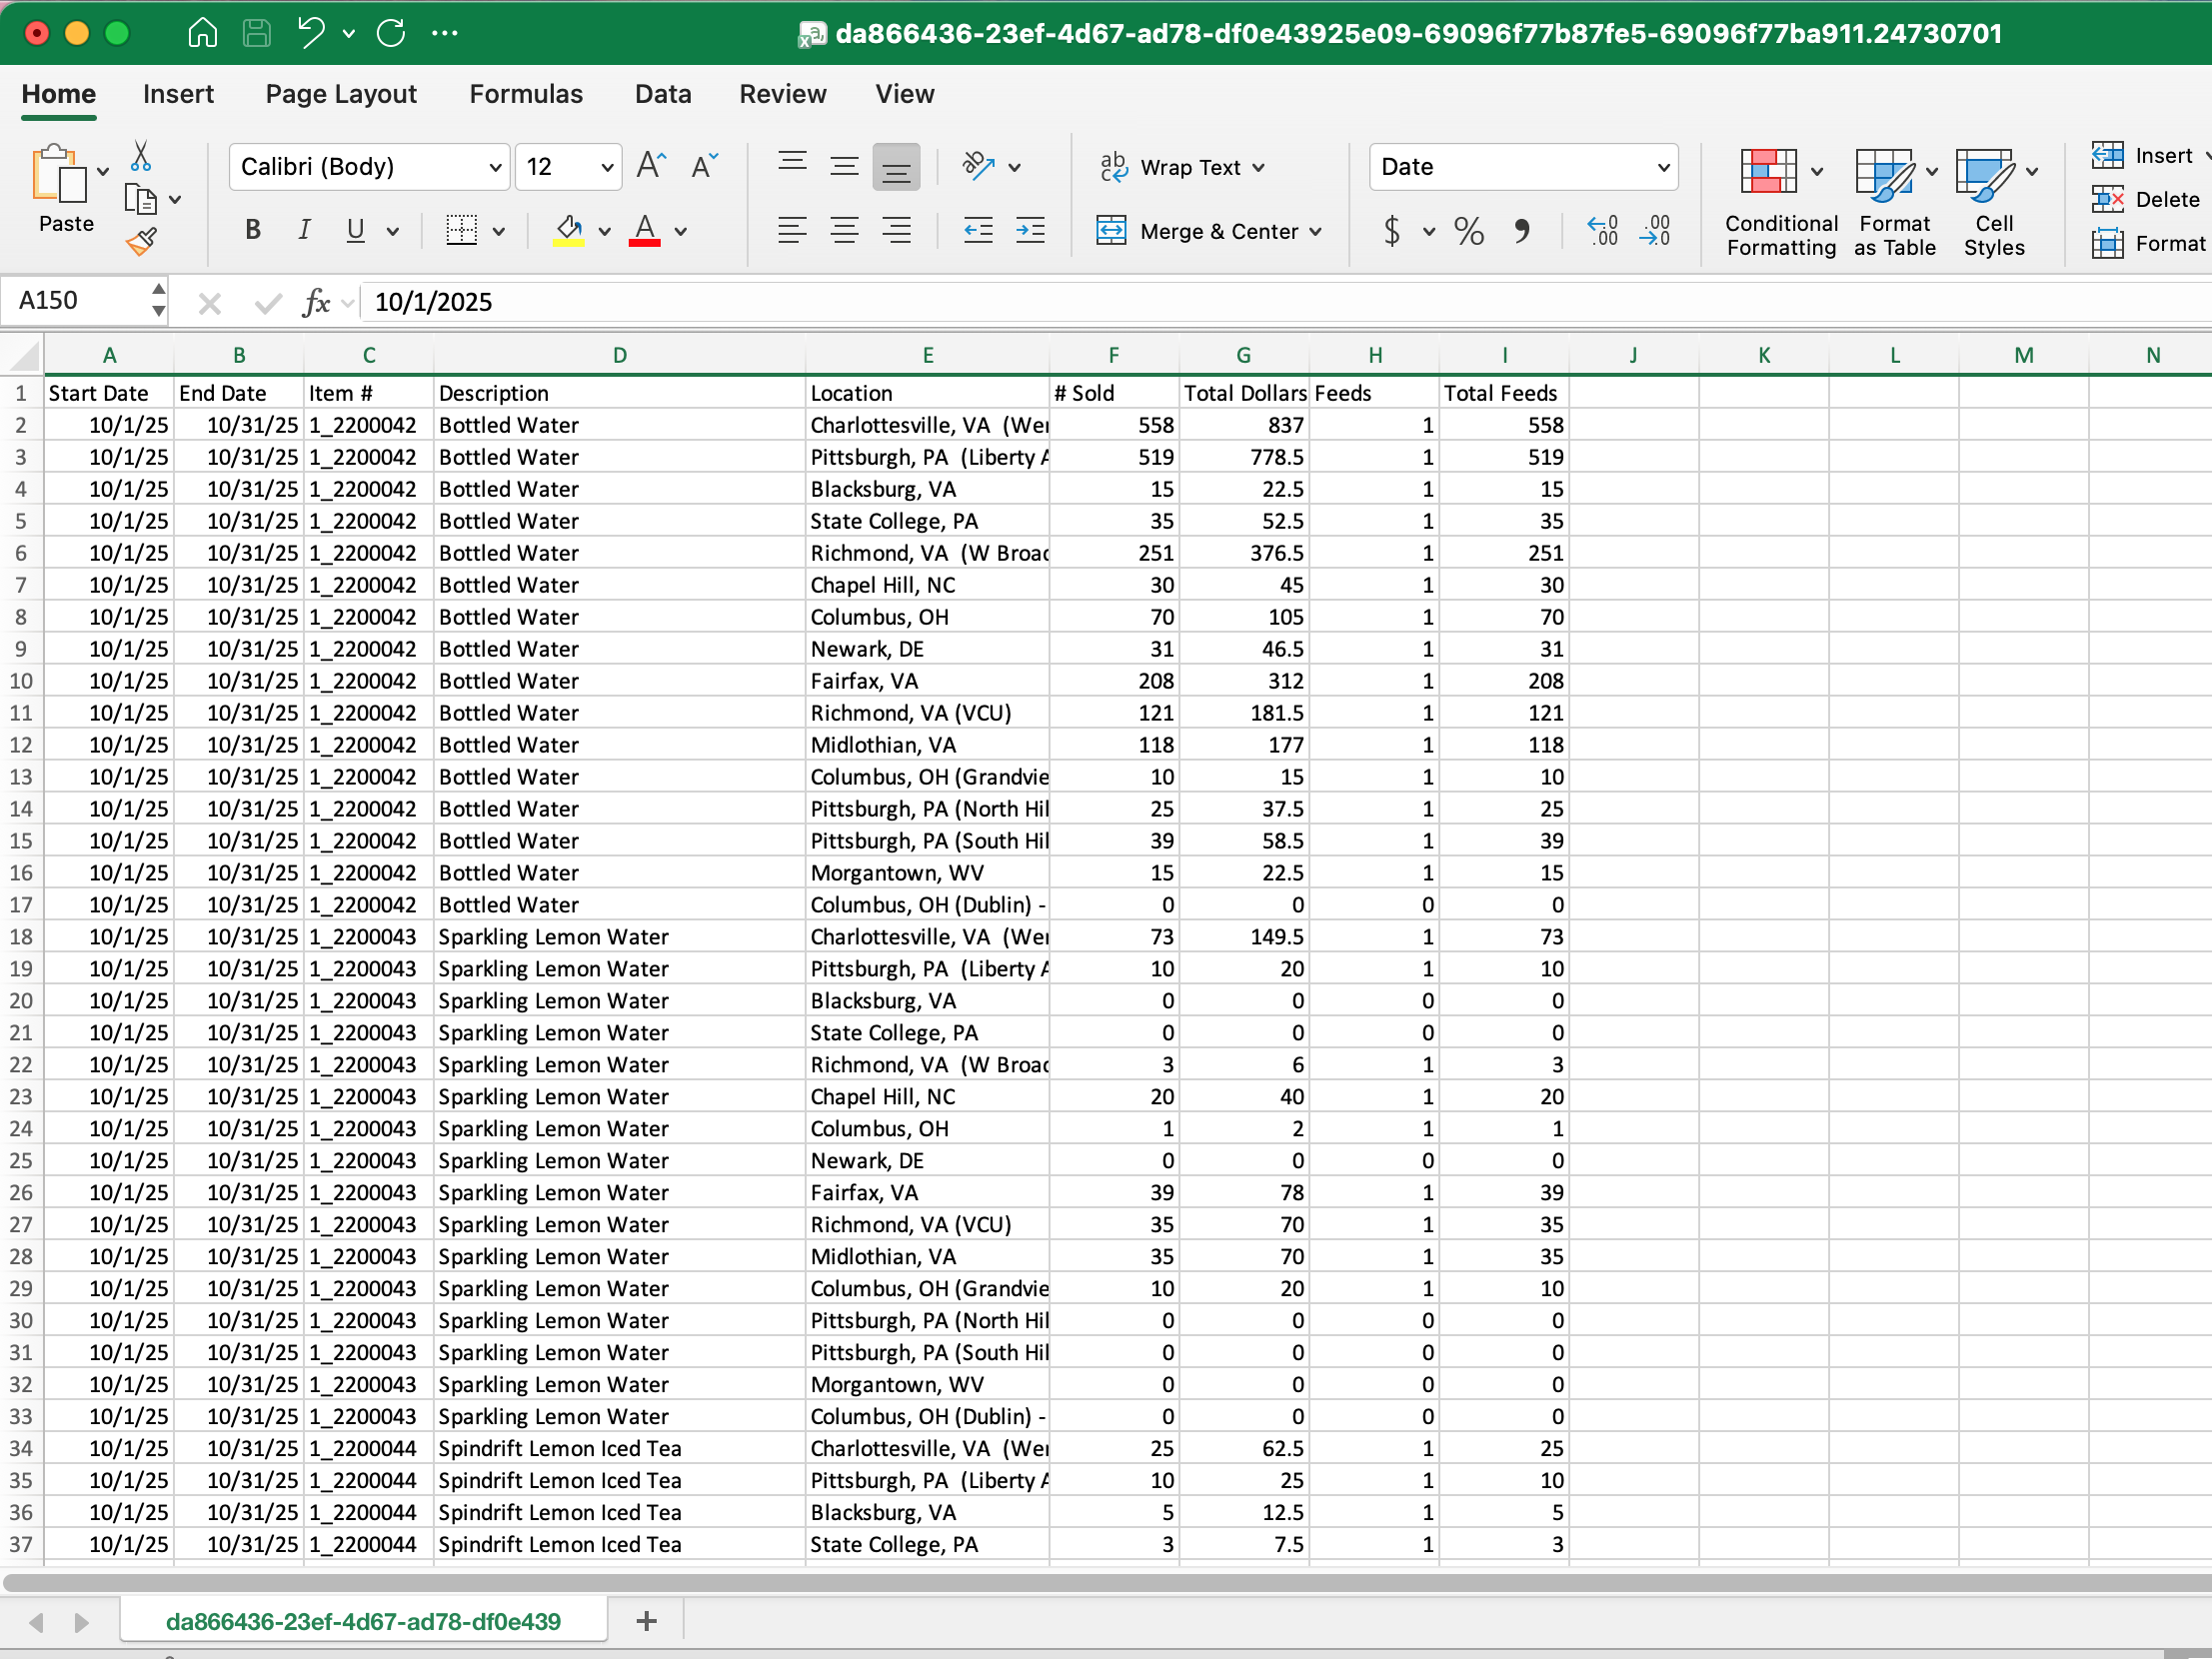
The exported spreadsheet includes the following information:
- Start Date
- End Date
- Item #
- Description
- Location
- # Sold
- Total Dollars Collected (Net)
- Feeds
- Total Feeds
Each row represents an individual menu item, modifier, or option choice and shows its sales activity for the selected date range and location.
Finding Modifiers and Option Choices
The report lists your regular menu items first. Continue scrolling down in the spreadsheet to find the modifiers and option choices associated with those items.
You can identify option choices by looking at the Item # column. Option choice item numbers begin with a 2.
Modifier descriptions generally display the option-set name followed by the selected choice in parentheses: Option-Set Name (Selected Choice)
Each option choice appears on its own row with the number sold for the selected date range and location.
To compare selections, sort or filter the following columns:
- Description: Find a particular menu item, modifier, or option set.
- Location: Compare results between different locations.
- # Sold: Identify the most and least frequently selected choices.
Common Use Cases
Identify Your Most Popular Menu Items
Sort the # Sold column from highest to lowest to see which menu items were ordered most often during the selected date range.
Find Low-Performing Menu Items
Sort the # Sold column from lowest to highest to identify items with few or no sales. This information can help you decide whether an item needs better visibility, a pricing adjustment, or removal from the menu.
Compare Option Choice Popularity
For example, a catering company may offer a sandwich platter with several sandwich choices. By locating the option choices in the PLU Sales Report, the company can compare the # Sold for each sandwich during the selected date range. This can help identify the most frequently selected sandwiches, recognize options that are rarely chosen, and make informed decisions about which choices to keep, replace, or remove from the menu.
The same process can be used to compare other option choices, such as:
- Sides
- Salad dressings
- Beverage flavors
- Entrée selections
- Sizes
- Upgrades
- Add-ons
Compare Sales by Location
Use the Location column to compare how the same menu items or option choices perform at different locations. An item that is popular at one location may be selected less often at another.
Support Menu Planning and Forecasting
Review past sales activity to help estimate future demand, prepare ingredients, and plan for seasonal menu changes.
Best Practices
- Run the report regularly to monitor changes in menu performance.
- Use a meaningful date range instead of relying on a small number of orders.
- Compare similar time periods when reviewing seasonal items.
- Review menu items and their option choices separately.
- Filter by location before making location-specific menu changes.
- Consider food cost, profitability, and operational complexity along with the number sold before removing an item.
- Export the report to Excel when you need to sort, filter, or compare a large amount of data.
Related Articles
Support
For additional help, refer to the CaterZen Support Center or contact our CaterZen Support Team.
Not a CaterZen customer yet? Discover how our catering software can streamline your business — click here to learn more!